TAM, SAM, SOM: three nested numbers, not one.
Market sizing has a standard shorthand: three nested numbers, abbreviated TAM, SAM, and SOM. Each one narrows the last. The discipline is in refusing to stop at the first, biggest one. Walk through all three every time, in order, and write each one down.
TAM, the Total Addressable Market, is the entire market for what you are proposing: every customer, everywhere, who could conceivably need this. It is the number that looks best on a slide, and it is almost never the number to make decisions against. TAM stands for ambition. It tells you how big the dream is, not how big your business will be.
SAM, the Serviceable Addressable Market, narrows TAM down to the slice you could realistically reach given your actual business model, geography, and channels. A company that sells only through a direct sales team in North America has a SAM that excludes most of the world, no matter how large the global TAM is. Ask yourself: who can we actually serve with the setup we have today?
SOM, the Serviceable Obtainable Market, narrows the picture once more: what could you actually capture in a reasonable timeframe, given the competitors already there and your own capacity to deliver? If TAM is the dream and SAM is the territory, SOM is the plan.
A fourth number completes the set: MVM, the Minimum Viable Market. This is the smallest market size at which you could sustain yourself. It is your floor. If your SOM lands below your MVM, the numbers are telling you to rethink the idea before you build it.
Why walk through all of them instead of quoting the biggest? Because TAM makes a great headline and a bad basis for a decision. A team that sizes an opportunity by TAM alone will chase markets it has no realistic path into: a hundred-billion-dollar category, minus the channel, the geography, or the credibility to reach more than a sliver of it. Skipping the exercise does not avoid this problem. It just postpones the discovery. And teams usually discover it after months of work rather than before a single line of code is written. The four numbers together force a more useful conversation, because each one demands a different justification: TAM asks what the world could want, SAM asks what you could serve, SOM asks what you could win, and MVM asks what you need to survive.
The good news: you do not need perfect data to do this well. You need honest logic, stated assumptions, and the willingness to write down a range instead of a fantasy. The next page shows you how.
How big is the market?
Market sizing forces focus. It turns "interesting" into "worth investing in" and helps you decide where to test first. Size the opportunity around the customer problem, not around your product idea. The problem defines who is actually struggling; the product only defines what you hope to sell them.
The TAM-SAM-SOM canvas walks you through the four numbers you just met:
- TAM (Total Addressable Market): total theoretical demand, without constraints. The largest possible market size. It stands for ambition.
- SAM (Serviceable Addressable Market): the part you can realistically serve, given geography, segment scope, channel access, regulation, and capabilities.
- SOM (Serviceable Obtainable Market): the nearterm share you can credibly win, considering resources, switching costs, and competition.
- MVM (Minimum Viable Market): the smallest market size at which you could sustain yourself.
Build your sizing logic from the problem:
- Start from the number of people affected, multiplied by frequency and economic or emotional impact. How many people have this problem, how often, and what does it cost them each time?
- Use ranges rather than false precision. A defensible "between 40 and 80 million" beats a made-up "63.7 million" every time.
- State your assumptions explicitly, so the team can challenge them now instead of tripping over them later.
- Visualize TAM, SAM, and SOM as nested circles. The gap between the circles is often more revealing than the circles themselves.
A quick example: invoicing software for freelancers.
- TAM: 60 million freelancers worldwide x $200 average annual revenue = $12 billion.
- SAM: the share reachable through your online channels in English-speaking markets, roughly 25% = $3 billion.
- SOM: a credible 0.5% share within three years = $15 million.
- MVM: at $400,000 in annual costs and $200 per customer, you need 2,000 customers to survive.
Output:
- A defendable opportunity range you can explain to a skeptic.
- Clear priority segments for experiments.
- Explicit assumptions that become must-test hypotheses in the steps ahead.
Formulas:
| TAM | (Total number of potential customers) x (Average annual revenue per customer) |
|---|---|
| SAM | (Percentage of the TAM that you could theoretically reach) x (TAM) |
| SOM | (Expected market share in %) x (SAM) |
| MVM | (Total Cost) x (Average revenue by customer) |
Work through the canvas as a team, not alone at a desk. The debate about each assumption is where the real sizing happens. When the numbers survive the discussion, you are ready to pick the segment where you will test first.
From a big number to a believable one.
Numbers are easier to use well once you have seen them in motion. So let's walk through an example instead of leaving TAM, SAM, and SOM as abstractions.
Picture a team proposing software that helps independent restaurants manage inventory and reduce food waste. The TAM is tempting to state as "every restaurant in the world": several million establishments, a genuinely enormous number, and exactly the kind of figure that makes a confident opening slide.
The SAM is smaller and more honest. This team builds a cloud product, sells in English, and supports payment and tax rules for a handful of countries at launch. That alone removes most of the global TAM. Look closer and more falls away. Independent restaurants below a certain size may not have the staff role this product assumes exists. Large chains often build or buy custom systems instead of adopting a product made for independents. What is left? English-speaking markets, independent and small-chain restaurants, above a minimum size that makes the subscription worth it. That is the real SAM, and it is very likely a small fraction of the original headline number.
The SOM narrows further still, to what is obtainable in the next year or two under real conditions. Two or three established competitors already sell into this exact space. The sales motion depends on word of mouth within a fragmented industry. And a small team can only onboard so many new customers per month, no matter how much demand exists. The realistic SOM might be a few thousand restaurants in the first eighteen months. That number will never make an exciting opening slide. But it is the number the team can actually build a plan, a hiring roadmap, and an honest set of expectations around.
Notice what happened along the way. Nobody commissioned deep market research. The team simply wrote down what it already knew: its own channels, its own capacity, the competitors it could name. Each constraint was a fact, not a guess. That is why the final number is believable where the first one was only impressive. If the discussion had stopped at TAM, all of that knowledge would have stayed locked in people's heads.
The gap between the number that excites a room and the number a team can plan against is the entire reason this exercise exists. So ask yourself: which of your numbers is on the slide right now? And which one is in the plan?
Tool
TAM-SAM-SOM canvas.
- PERSONAL
- map TAM/SAM/SOM insights
- ± 45 MIN
- session
- 3-5
- people per group
Most teams overestimate their market. TAM–SAM–SOM helps ground ambition in reality— clarifying where you can truly compete and win.
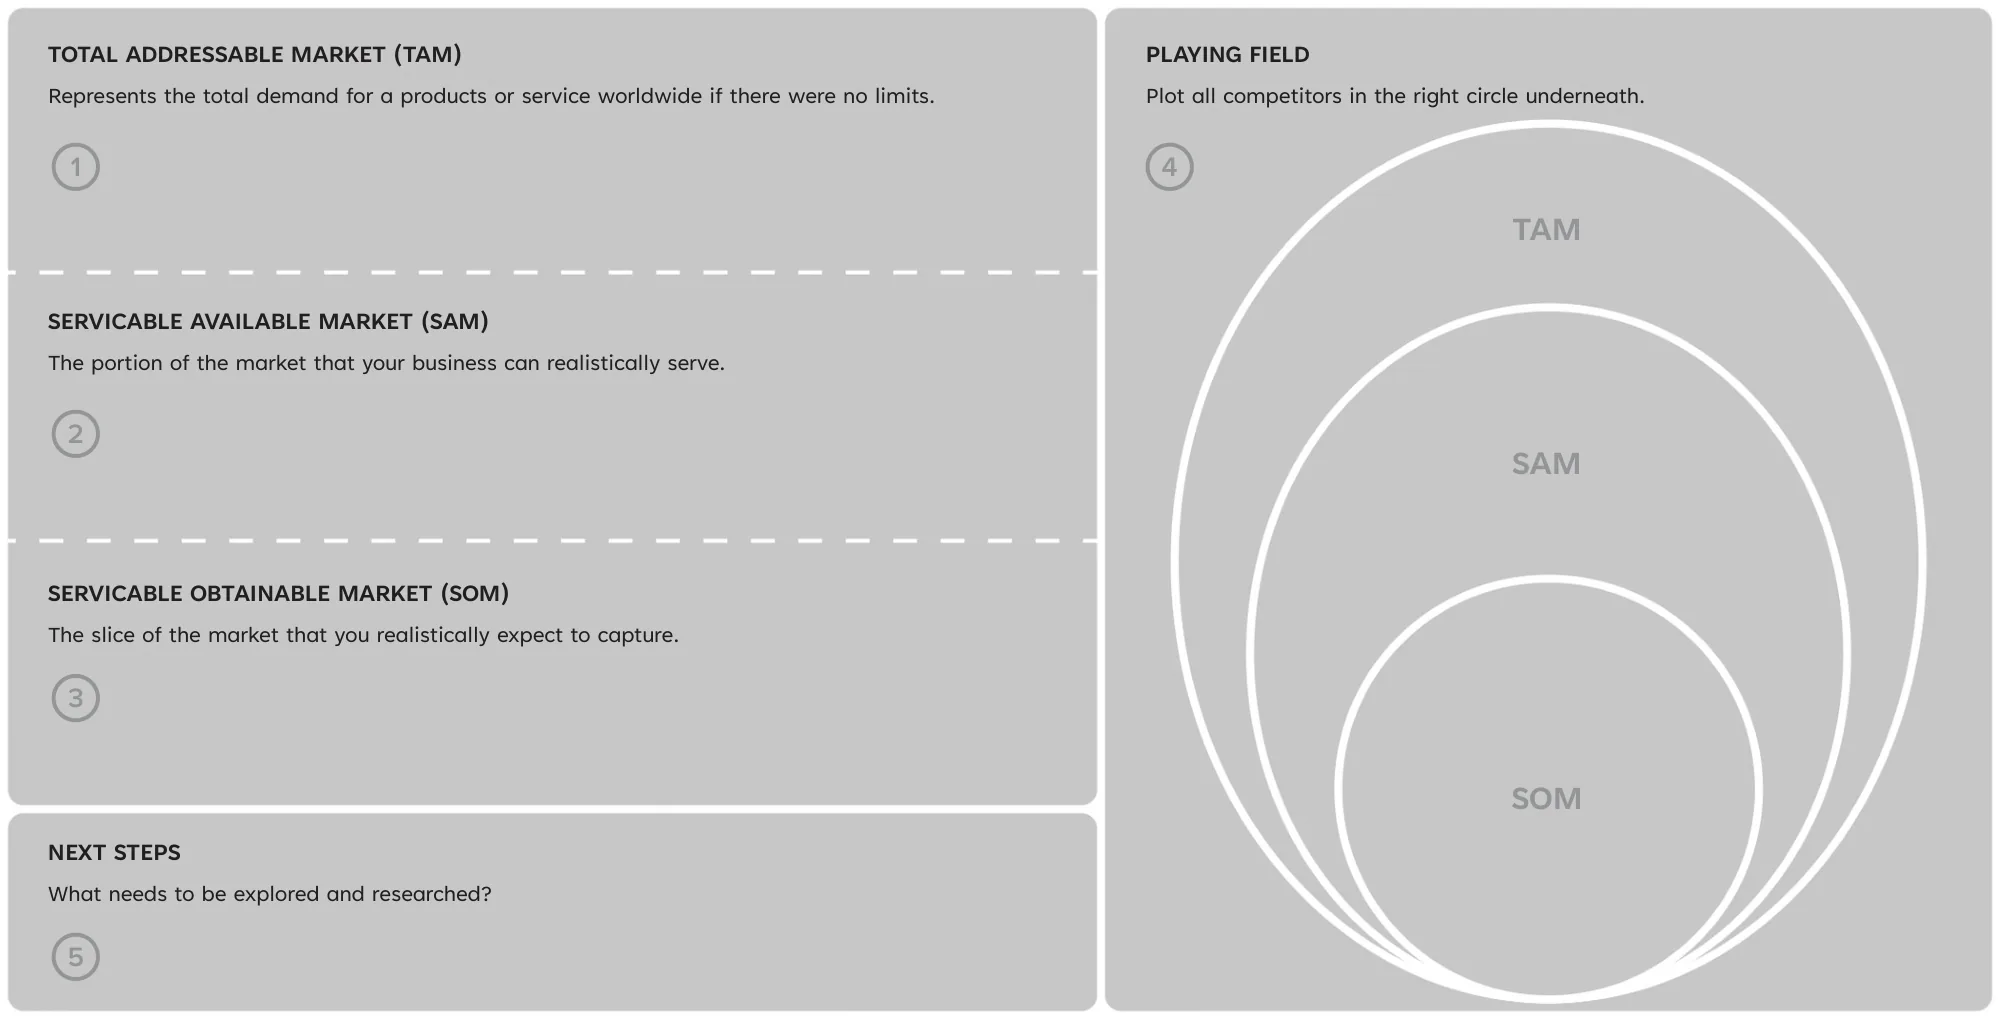
When you're building a product or growing a business, it's easy to assume everyone out there is a potential customer. But the reality is more nuanced. That's where TAM, SAM, and SOM come in. These three layers help you break down your market: From the total demand, to the people you can actually reach, to the customers you're most likely to win. This canvas gives you a practical way to think through where to focus, who you're competing with, and what you need to explore next.
Total addressable market (TAM)
Represents the total demand for a product or service worldwide if there were no limits.
Explanation: This is the broadest estimate of potential market size. It assumes that your product or service could be sold to every possible customer in the world without constraints such as geography, regulations, competition, or business capacity.
Serviceable available market (SAM)
The portion of the market that your business can realistically serve.
Explanation: This narrows the TAM to the markets that are realistically within your reach; for example, filtered by geographic region, customer type, legal access, or product specialization. It reflects the market you could actually serve given your current capabilities and constraints.
Serviceable obtainable market (SOM)
The slice of the market that you realistically expect to capture.
Explanation: This is the most focused segment; the share of SAM that you can reasonably win over in the short-to-mid term, based on your marketing efforts, competitive positioning, pricing, and sales capacity. It represents your target market.
Playing field
Plot all competitors in the right circle underneath.
Explanation: This section is visual; a Venn-diagram-like field where you map competitors within the TAM, SAM, and SOM circles to understand their relative positioning and market focus. It helps visualize where you and others operate and compete.
Explanation: This area is for action points; what market research, validation, or assumptions still need to be tested to refine your TAM, SAM, and SOM calculations. It may include identifying customer needs, testing pricing, or analyzing competitors.
Numbers alone are not enough.
Market sizing works alongside direct research, not instead of it: interviews, trend scanning, competitive review.
The two do different jobs, and neither substitutes for the other. The numbers tell you whether an opportunity is large enough to be worth exploring further. The research tells you whether you actually understand it. Does the restaurant owner really experience food waste as a top-three problem? Or have you simply assumed so because the story is compelling?
A team with a large, carefully sized SOM and no direct research is building on an assumption it has not tested. A team with rich research and no sizing discipline may have found a real problem that only a few hundred people in the world actually have. Both belong in this step, at the same time, checking each other.
What is going on in the market?
Before spending time on interviews or building "solutions", use existing evidence to stress-test and sharpen your hypotheses.
- Desk research provides breadth. It helps you see patterns, avoid local bias, and ground your assumptions in data.
- Scan market trends that influence the problem: technology shifts, regulation, economic conditions, and category growth or decline.
- Look for behavioral signals: adoption rates, search trends, purchase patterns, churn reasons, and common complaints.
- Gather benchmarks: prices, conversion norms, time-to-value, and service expectations.
- Map the competitive landscape and alternatives, including substitutes and the "do nothing" option. These set the baseline customers compare you to.
- Identify evidence gaps: what you cannot confirm with existing sources, and what must be explored in primary research.
Sources of secondary market research:
- Public reports and government data, such as census data, industry reports, and economic statistics.
- Trade associations and industry publications, such as market reports and whitepapers.
- Market research firm reports from Gartner, Nielsen, or Statista.
- Academic research and case studies from universities and business schools.
- News articles and business magazines.
Output:
- Refined hypotheses: stronger, more specific, better worded.
- A list of open questions to answer in sizing and interviews.
- A clearer, evidence-informed problem framing.
How are our competitors solving this problem?
Competitor research is not a feature checklist. It is a way to understand the experience bar, the rules of the category, and where customers still struggle. Done well, it prevents you from building "more of the same."
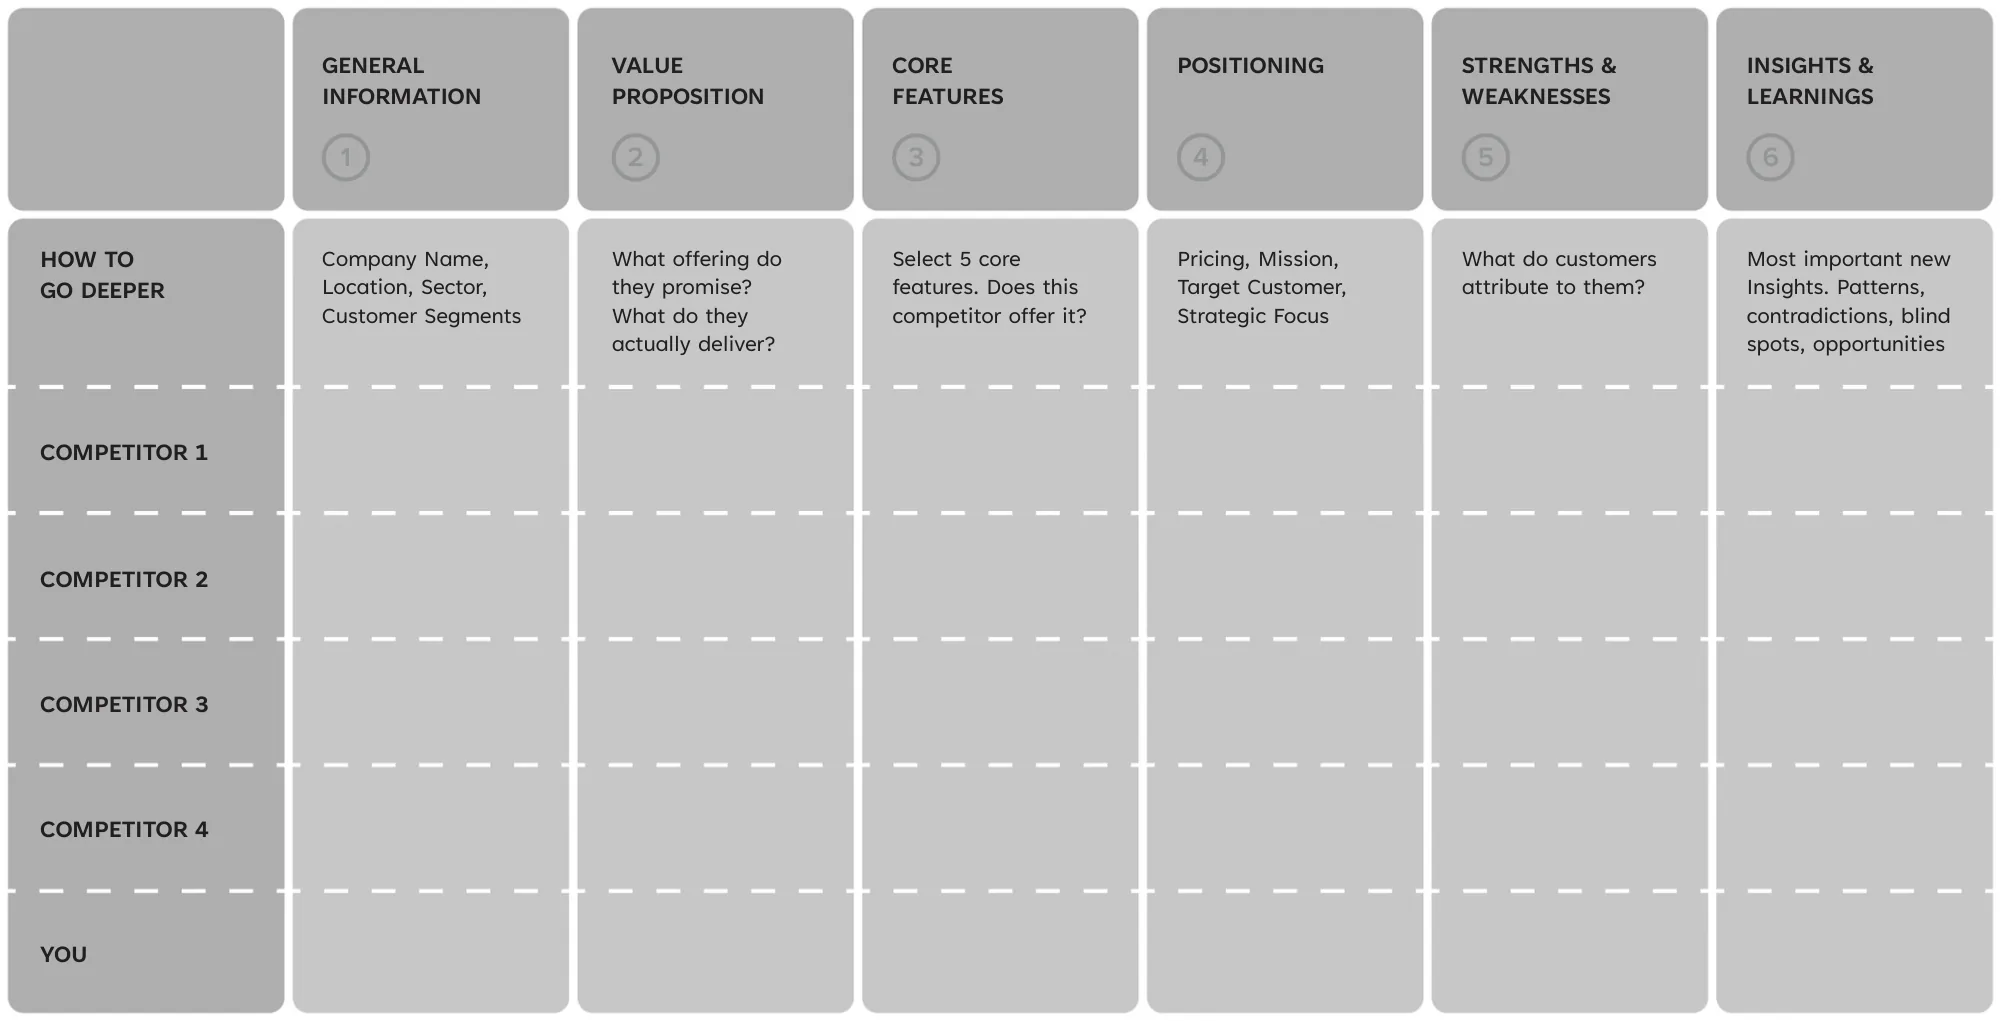
You do not need expensive tools for this. Sign up for competitor trials and walk through their onboarding yourself. Read their reviews, especially the two- and three-star ones, where customers explain what almost worked. Browse support forums and complaint threads. That is where the experience bar becomes visible. And if you want to dive deeper into this step, use the competitor canvas.
Map competitors and substitutes on:
- Promise versus delivered experience: what they claim versus what customers actually get.
- Core flows and usability: where friction, confusion, and drop-off occur.
- Pricing, packaging, and positioning: who they target and how they justify their price.
- Strengths and weaknesses, especially patterns in reviews, complaints, and praise.
- Substitutes and "do nothing". Inactivity is often the strongest competitor.
Translate insights into the baseline you must beat: Speed, clarity, control, reliability, and any category-specific metrics. Customers will not judge you against your ambitions. They will judge you against the best experience they already know.
Output:
- Two or three sharp differentiation hypotheses.
- A first direction for channels and pricing logic.
- A sustainable service promise that matches the gap you aim to own.
Between the desk research and the competitor map, you now know what the market looks like and what customers are already being offered. But one of these research activities deserves a closer look before we move on.
Who else is already solving this?
Of the three research activities named above, competitive review deserves its own closer look, because it does something the other two do not.
It tests whether your SAM and SOM are honest rather than optimistic. A team can size a market carefully and still be wrong if it has not asked one blunt question: what is the customer already using instead of us, right now, today?
"Instead of us" is broader than it first sounds. It includes the direct competitors selling essentially the same solution. But it also includes the indirect ones: the spreadsheet, the paper notebook, the generic tool pressed into service, or simply the manual workaround a customer has learned to live with. Back in the restaurant example, the real competition for an independent café is rarely one of the two established SaaS players chasing large chains. It is the notebook by the register that the owner has used for a decade and does not think of as a "competitor" at all.
The previous step gave you the raw material: the promises, the pricing, the patterns in reviews and complaints. Now turn that material into a decision tool. The tool for the job is the Competitive Landscape Map, and it is a simple grid. List each direct and indirect alternative down one side. Across the top, capture the segment it actually serves, its pricing model, its core strength, and the column that matters most: the specific gap it leaves open.
The point is not to produce an exhaustive catalog of rivals. Nobody needs forty rows. The point is to find the gap your value proposition will eventually need to exploit, and to pressure-test your SAM and SOM against it. A SOM that assumes easy, uncontested growth looks very different once the map shows three funded competitors already spending heavily to acquire the exact same customer. Ask yourself: if this map is right, why would that customer switch to us? If the answer takes more than a sentence, the gap column needs more work.
One warning before you move on. A team that only glances at the two or three obvious direct competitors will miss the much larger, much quieter competitor that every customer already has: doing without, or making do. That competitor charges nothing, requires no onboarding, and never has an outage. Beat the notebook by the register first. Then worry about the SaaS players.
Tool
Competitor canvas.
- PERSONAL
- Map competitor insights
- ± 120 MIN
- session
- 2-6
- people per group
Imagine this… You're working on a new retail concept. You believe you understand why the leading player dominates the market: Low prices, many stores, large volumes. But when you study the field more closely, you realize something unexpected:
- The store feels cluttered and overwhelming.
- The assortment inspires very little.
- Their online presence adds almost no value.
- Their promise is functional rather than inviting.
And then the realization hits: You were looking at their visible strengths, but not at their hidden weaknesses. If you had built on assumptions alone, you would have copied the wrong things and missed the space where your organization could have made a genuine difference.
That is why understanding the competitive landscape matters.
Competition is rarely about having the lowest price or the biggest assortment. It's about understanding how others show up, what they promise, what they actually deliver, where they excel, and where they fall short. The Competitor canvas helps you see that with clarity.
Just as the Customer Problem canvas helps you understand the world your customer lives in, the Competitor canvas helps you understand the context in which customers make decisions: The alternatives they see, the expectations shaped by competitors, and the opportunities that remain untouched.
Many teams overestimate how well they know their competitors. In reality, strategic decisions are often shaped by habit, intuition, or internal narratives rather than by observed market behavior. This tool helps you break that pattern.
Everything begins with one essential question: Where is the market moving and where is there room for meaningful difference?
A shared window into the market
The Competitor canvas offers a clear, structured way for teams to:
- understand what competitors promise,
- see what they actually deliver,
- analyze how they position themselves,
- identify their strengths and weaknesses,
- and most importantly, discover the space where your organization can add meaningful value.
It's not just a list of facts. It's a tool for revealing insights and guiding strategy, positioning, and innovation.
Strategic advantages of the canvas
- Clarity before strategy: You base decisions on insight, not on assumptions.
- A shared view across teams: Less debate, more alignment.
- Customer-centered strategy: You understand where expectations come from and where they fall short.
- Sharper positioning: You can craft your story in deliberate contrast to others.
- More focused creativity: You know exactly where new ideas will have the most impact.
Use the Competitor canvas when:
- Developing a new proposition
- Repositioning a brand or concept
- Entering a new market
- Refining your strategic direction
- Seeking to understand how customer expectations are formed
It is especially powerful early in strategic and creative processes, when direction is still open.
The components of the Competitor canvas
General. Who are they, where are they, and how big are they? You capture website, regions, locations. This sets the scale and scope of each player.
Propositions. What do they promise and what do they deliver? You document their Value Proposition and their actual assortment or services. This exposes the gap between claim and reality.
Core Features. What do customers actually experience? For five key features, you mark whether each competitor offers them. This reveals patterns and gaps in the market, what everyone does, and what no one does.
Positioning. How do they want to be perceived? You record pricing, mission, target customer, and strategic focus. This helps you understand why they make the decisions they make.
Strengths and weaknesses. The truth through the customer's eyes What do customers appreciate? Where do they get frustrated? This turns customer sentiment into strategic insight.
Insights and learnings. Where everything comes together Patterns, contradictions, blind spots, opportunity areas. This is the foundation for direction and decision-making.
What happens when you do understand the landscape?
- You discover the white space: Areas where others do not operate.
- You shift from competing on price to competing on value.
- You make decisions with direction and confidence.
And when you don't?
- You copy the wrong things.
- You miss emerging opportunities and threats.
- You choose battles you cannot win.
- You waste valuable time, energy, and budget.
How to use the Competitor canvas
A step-by-step approach:
Step 1. Select 3–5 relevant competitors
Direct, indirect, and at least one unexpected player.
Step 2. Complete the general section
Establish scale, presence, and context.
Step 3. Describe their propositions
What do they claim? What do they actually offer?
Step 4. Score the core features
Spot the patterns and the white space.
Step 5. Fill in positioning
Pricing, mission, target customers, focus.
Step 6. Gather strengths and weaknesses
Use reviews, observations, and customer signals.
Step 7. Extract insights
Read horizontally and vertically across the canvas.
Step 8. Translate insights into opportunities Identify promising directions, strategic choices, or experiments.
Next step
Validate your insights with real customers.
Ask them:
- Who do you compare us to?
- What do you miss in the current alternatives?
- Where do things not work well?
- What would a better option look like?
The overlap between customer insight and competitive insight is where true opportunity lives.
Target the right customer segment.
Know who your customers are before someone else does.
Targeting the right customers is essential for business success. Research shows that 80% of a company's revenue typically comes from just 20% of its customers (Pareto Principle).
Companies that tailor their marketing using customer insights see, on average, a 20% increase in sales (McKinsey). Retaining existing customers is also far more cost-effective, as acquiring a new customer can be up to five times more expensive than keeping a current one (Harvard Business Review).
On the other hand, focusing on the wrong audience wastes resources. 60% of marketers report inefficient spending due to poor targeting (HubSpot). It also harms retention: 91% of dissatisfied customers leave silently, without complaining (ThinkJar), eroding long-term profitability. By identifying and prioritizing the ideal customer, businesses can boost engagement, optimize marketing spend, and strengthen loyalty. Companies that deeply understand their audience are 60% more profitable than those that don't (Deloitte).
Understanding who your right customer is can make or break your business. When you clearly identify and target the customers who truly need, want, and value your product or service, you can focus your efforts, improve your messaging, and deliver greater value. This leads to stronger customer relationships, better conversion rates, and more efficient use of resources. In a crowded market, knowing your ideal customer isn't just helpful; it's essential for growth and long-term success.
this seems obvious, but it is not, so we point it out to you
What if you target the wrong customer?
Wasted marketing budget
Your campaigns, ads, and content reach people who aren't truly interested. Customer acquisition costs go up, while your return on investment stays low.
Low conversions and disappointing sales
A mismatch between message and need leads to dropped carts, lack of engagement, and underwhelming revenue.
High customer churn
Even if some mismatched customers buy, they rarely stick around. Without real alignment, loyalty doesn't form and long-term value disappears.
Misguided product development
You end up building features or services that don't address the actual needs of your ideal customer, making true value creation harder to achieve.
Brand reputation damage
Unhappy customers leave negative reviews. That hurts your credibility and makes it more difficult to attract the right audience later on.
What if you target the right customer?
Higher sales and revenue
Conversions go up. Why? Because your solution fits an actual customer need. You're not selling features, you're solving a real problem.
Lower marketing costs
Focused campaigns mean less waste. Your ads become more efficient, and every Dollar delivers stronger returns.
Stronger customer loyalty
Customers who feel understood stick around. They come back, repurchase, and tell others about you.
Efficient resource allocation
Your teams know exactly who they're building, selling, and supporting for. That makes your business sharper, faster, and more effective.
Competitive advantage
Truly understanding your ideal customer helps you position your brand in a unique way and stay ahead in a crowded market.
Segmenting customers by needs, value, and problems.
Most organizations believe they understand their customers. They can describe them by industry, company size, age, geography, or revenue. They have personas with names and stock photos. They know where their customers live and sometimes even how they spend their time. And yet growth stalls. Marketing feels generic. Sales cycles drag. Pricing pressure increases.
Why? Because demographics do not explain decisions. Profiles do not explain urgency. And categories do not explain willingness to pay. Customers do not buy because of who they are. They buy because of what they are trying to achieve, what is blocking them, and what that success is worth to them.
This chapter introduces a more strategic way of thinking about segmentation, one grounded in needs, value, and problems. Instead of grouping customers by attributes, we group them by shared struggles and desired outcomes. Instead of asking, “Who are they?” we ask, “Why would they choose us?”
When you segment based on needs, you uncover where urgency is highest. You discover where willingness to pay is strongest. You clarify where your differentiation truly matters. You stop spreading effort across markets that look attractive but lack intensity. Needs-based segmentation shifts the focus from market size to value concentration. It helps you identify not just customers, but the right customers.
In the following pages, we will walk step by step through a practical framework to identify the jobs customers are trying to get done, surface the problems that create real friction, clarify the outcomes they value most, cluster customers into meaningful segments, validate those segments with real-world insight, and prioritize where to compete.
The goal is to create sharper strategic focus, because in the end, competitive advantage does not come from serving more customers; it comes from deeply understanding the ones that matter most.
Shift the segmentation lens
From “Who they are” to “Why they buy”
Move from demographics/firmographics to:
- Jobs-to-be-done
- Problems experienced
- Desired outcomes
- Value drivers
Why this step matters:
- Demographics rarely explain purchasing behavior.
- Two companies of the same size can buy for completely different reasons.
- Competing on profile leads to commoditization.
- Competing on need leads to differentiation.
If you don't shift the lens, you optimize marketing. If you do shift the lens, you optimize strategy.
Identify jobs, problems, and desired value.
To understand your customer properly, break this into three connected layers that reveal what drives decisions and behaviour.
Jobs (What are they trying to achieve?)
Customers are always trying to make progress in their lives, and these jobs can be functional, emotional, or social. Functional jobs relate to practical tasks, emotional jobs reflect how customers want to feel, and social jobs connect to how they want to be perceived by others. Jobs matter because they reveal stable demand: products may change, but the underlying job remains consistent. Anchor strategy in jobs and you shift focus from features to customer progress, giving clearer direction for innovation and decision making.
Problems (What frustrates or blocks them?)
Once you understand the job, identify what gets in the way. Look at how often the problem occurs, how severe it is, the cost of inaction, and the emotional intensity it creates. These factors indicate how much the problem truly matters. Strong problems drive behaviour: pain intensity predicts willingness to pay, urgent problems shorten sales cycles, and severe problems justify premium positioning. A poorly defined problem weakens your pricing power and your proposition.
Desired value (What does success look like?)
Finally, define what success looks like from the customer's perspective: outcomes such as speed, simplicity, certainty, prestige, return on investment, or reduced risk. Different segments prioritise different outcomes, which means value is shaped by what matters most to each group. These value drivers influence how you communicate, position, and price your offer. If value is not clearly defined, you risk competing on price rather than on differentiation.
Example: In these examples, we use a kitchen company as the consistent context. As a business designer, you need to deeply understand what customers are trying to achieve in their daily lives before you can define the right segments.
Step 1: Jobs (What are they trying to achieve?) Customers are not simply buying a kitchen. They are trying to create a space that fits naturally into their daily lives. They want to cook efficiently, spend quality time with family, entertain guests comfortably, and improve both the feel and the value of their home. For some, this is about upgrading functionality and making everyday tasks easier, while for others it is about expressing personal style or marking a new phase in life.
Step 2: Problems (What frustrates or blocks them?) Customers often struggle with kitchens that no longer support their needs: outdated layouts that disrupt flow, limited storage that creates clutter, aging appliances, and inefficient use of space. The process itself can feel overwhelming, with too many choices to navigate, unclear pricing, long timelines, and concerns about unreliable contractors. Budget constraints and the fear of making the wrong decisions add pressure and delay action.
Step 3: Desired value (What does success look like?) A successful outcome is a kitchen that feels intuitive, beautiful, and built around their specific needs. It works seamlessly, looks great, stays within budget, and arrives without unnecessary complications. Ultimately, customers want confidence in their decisions and a space that enhances everyday living while adding value.
Cluster customers by pattern.
Once you understand what customers are trying to achieve, where they struggle, and what they value, the next step is to look for patterns across these insights. Not every customer is as unique as they first appear. Beneath the surface, many share similar jobs to be done, experience comparable frustrations, care about the same outcomes, and feel a similar urgency to act. The goal is to group customers by what truly drives their decisions, rather than how they look on paper or how they are traditionally categorized.
As patterns emerge, complexity reduces and the picture becomes clearer. Instead of facing an overwhelming variety of individual needs, you begin to see a smaller number of meaningful clusters, each representing a group of customers with aligned motivations and similar expectations. This is where real customer segments take shape: not from assumptions or surface level categories, but from observed behavior and shared needs that consistently appear across different customers.
Why does this step matter? Because it brings focus and direction to your thinking. It shows where you can design a standardized, scalable offer that still feels highly relevant to a specific group. It also helps you avoid the trap of over customization, where trying to satisfy everyone leads to diluted value and operational inefficiency. Cluster first, and you turn raw insight into clear strategic direction: a strong foundation for deciding where to play and how to win.
Example: When you look at customers through the lens of jobs, problems, and desired value, patterns begin to surface. Not everyone who wants a new kitchen is trying to achieve the same thing, or feeling the same urgency.
One group of customers is focused on functional improvement. Their job is to fix what is not working: inefficient layouts, lack of storage, outdated appliances. Their pain is high and immediate, and they feel blocked in their daily routines. They value practicality, reliability, and a smooth, predictable process, and their urgency is high, driven by daily inconvenience. These customers cluster around a clear need: "Make my kitchen work again."
Another group is driven by lifestyle and experience. They want a kitchen that becomes the heart of the home, a place to gather, host, and enjoy time with others. Their problems are less about breakdowns and more about limitations, where the space does not reflect who they are or how they want to live. They value aesthetics, atmosphere, and thoughtful design, and their urgency is moderate, often linked to life moments like moving house or family changes. Their shared pattern is: "Help me create a space I'm proud of."
A third group is motivated by investment and value creation. Their job is to increase the value of their home, whether for resale or long term equity. Their pain is tied to uncertainty about which choices will pay off and which will not. They value guidance, smart trade offs, and confidence that their investment is sound, and their urgency depends on timing in the housing market or financial planning. Their pattern becomes: "Help me make a smart investment."
By clustering customers this way, based on similar jobs, pain intensity, value drivers, and urgency, you move from a scattered view of individual needs to focused segments with clear, targeted propositions for each group. This is where insight turns into strategy, and where you decide which patterns to prioritize and how to win.
Tool
Persona canvas.
- PERSONAL
- Persona canvas insights
- ± 45 MIN
- session
- 2-6
- people per group
You cannot create the WOW unless you deeply understand the human you design for.
The Persona canvas is built to help you step into the world of your customer: To see what they see, feel what they feel, struggle with what they struggle with, and aspire to what they hope for.
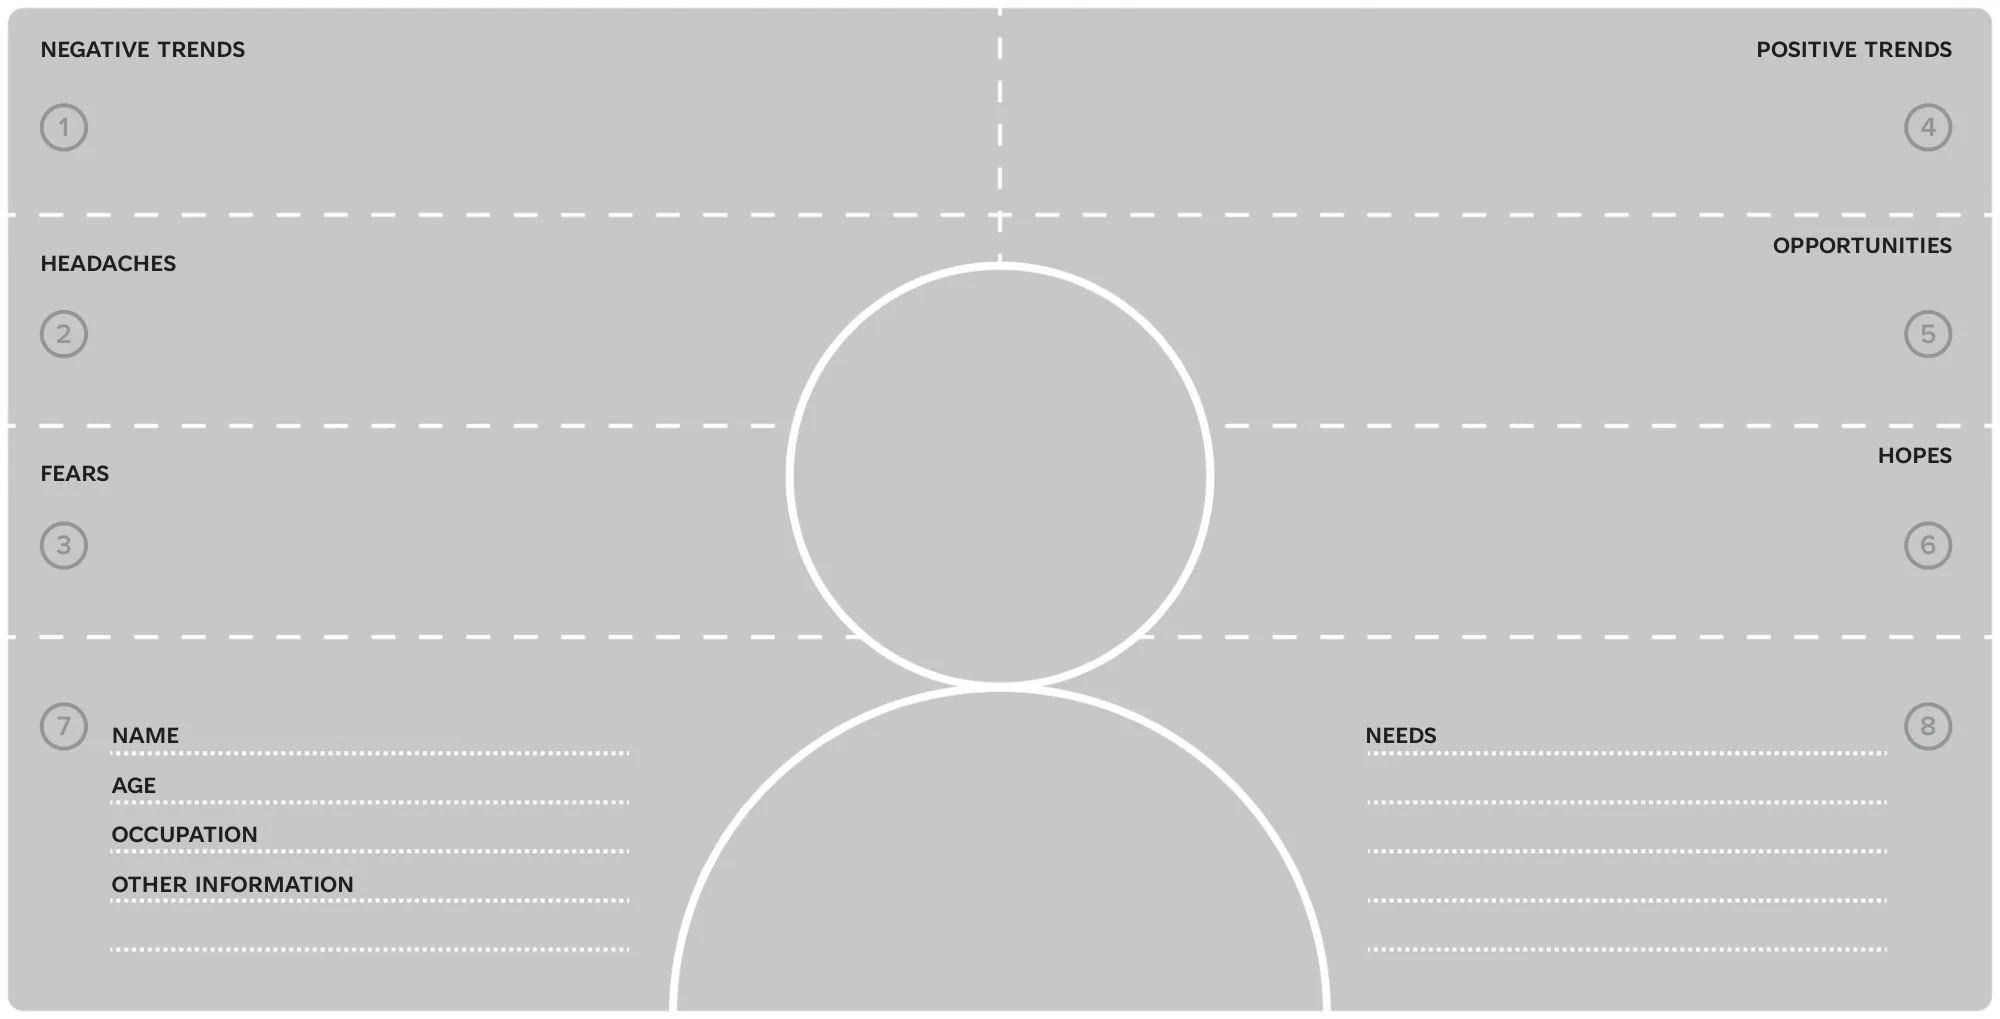
It turns abstract “target audiences” into living, breathing humans that your team can empathize with, design for, and make better decisions around. This canvas gives you a structured, visual way to understand the tensions, pressures, motivations, and needs that shape human behavior. It becomes a strategic lens for innovation, not a superficial profile. The building blocks of the persona canvas:
Negative trends
The external forces shaping pressure, constraints and complexity. Negative Trends represent broad developments in the persona's world that make life harder, forces they did not choose but must react to. These trends form the backdrop against which challenges arise.
Examples include:
- Increasing complexity in tools, processes, or regulations
- Market pressures, budget cuts, or instability
- Shifts in work culture, autonomy, or performance demands
Why this matters: Negative trends set the environmental tension in which the persona operates. They influence how overwhelmed, uncertain, or constrained this person may feel, and they frame the problems that your solution must help address.
Headaches
Everyday frustrations that drain energy, time and motivation. Headaches are concrete, specific pain points that the persona encounters repeatedly. They are not theoretical irritations; they are lived moments of friction that slow progress, create confusion, or erode confidence.
Examples include:
- Re-entering the same information across multiple tools
- Poorly designed workflows causing inefficiency
- Constant interruptions or a lack of clarity
Why this matters: Headaches reveal design opportunities. They show where friction is highest and where a small improvement could create a big impact. They also help your team understand what “pain relief” really looks like for this person.
Fears
Deep concerns that shape avoidance, hesitation, and decision-making. Fears go below the surface. They reflect future-oriented anxieties that influence how this person behaves, especially what they avoid doing.
Examples include:
- Fear of making a wrong choice
- Fear of appearing incompetent or unprepared
- Fear of financial risk or instability
Why this matters: Fears explain why people freeze, delay, overcompensate, or choose the safest option. If you don't understand their fears, you cannot design experiences that feel safe enough for them to take meaningful action.
Positive trends
External developments that create momentum, opportunity, and empowerment.
Positive trends represent forces in the world that are moving in the persona's favor. These trends create possibility, momentum, and confidence they show where “the wind is behind their back.”
Examples include:
- Increasing access to better tools, automation, or AI
- Cultural shifts toward flexibility, wellbeing, or autonomy
- Expanding market opportunities
Why this matters: Positive trends reveal growth spaces where your persona has leverage, optimism, and the potential to adopt new solutions.
Opportunities
Practical openings where you can create value for this person. Opportunities are where the persona's world intersects with your ability to deliver meaningful impact. They highlight where a solution, service, feature, or behavior change can make a measurable difference.
Examples include:
- Helping the persona make confident decisions
- Offering clarity where ambiguity dominates
- Reducing workload by automating repetitive steps
Why this matters: Opportunities help you shape your Value Proposition. They transform abstract insights into actionable design directions, making it clear where you can solve real problems or unlock meaningful gains.
Hopes
The desired future that motivates this person to move forward. Hopes are the emotional engine behind progress. They are not superficial wishes, they represent what this person truly desires in their life, career, or daily experience.
Examples include:
- “I want to feel confident and capable.”
- “I want to grow and stay relevant.”
- “I want more balance and control in my day.”
Why this matters: Hopes define what “good” looks like for the persona. They describe the pull toward the future the vision that your solution can help realize.
Identity
The human at the center of this canvas. This section grounds the persona with essential human details:
- Name: A real name creates emotional connection and memorability.
- Age: Age indicates life stage, priorities, motivations, and constraints.
- Occupation: Reveals routines, responsibilities, skills, expectations, and pressures.
- Additional context that shapes behavior, such as: Family situation, experience level, digital proficiency, and personality traits or habits
Why this matters: Identity transforms your persona from an abstract idea into a relatable human being that your team can empathize with and design for.
Needs
The fundamental drivers behind functional, emotional, and social behavior. Needs are the core of the Persona canvas because they explain why this person behaves the way they do. Understanding needs helps you design solutions that resonate on a deeper level. Map the functional needs (e.g. efficiency, guidance, clarity), emotional needs (e.g. confidence, belonging), and social needs (e.g. being perceived as competent, trustworthy etc.).
Why this matters: Needs provide the foundation for your Value Proposition, Customer Journey, messaging, and solution design. Every meaningful innovation solves a real need.
How to use the Persona canvas: Step 1. Start with identity Anchor your persona in reality.
Step 2. Map the negative side
(Trends → Headaches → Fears) Reveal barriers, frictions, and risks.
Step 3. Map the positive side
(Trends → Opportunities → Hopes) Reveal potential, desire, and momentum.
Step 4. Identify needs
Turn insights into design criteria.
Step 5. Validate with real customers
Personas are hypotheses until validated.
B2C Customer persona breakdown.
Before you start selling, you need to know who you are actually selling to. In the B2C world, it is all about emotion, convenience, and experience. A well-crafted customer persona helps you truly understand the needs, expectations, and behavior of your ideal consumer.
A persona is not just a random profile. It is a clear, humanized picture of who your customer is, what drives them, and how your brand can connect with their world. The difference matters in practice: a team that knows "women aged 25 to 40" designs for a statistic, while a team that knows Emma designs for a person. One produces generic campaigns. The other produces messages that feel like they were written for someone specific, because they were.
Key elements of a customer persona in B2C: Persona: A B2C persona is a semi-fictional representation of your ideal customer, grounded in both data and empathy. Ground it in real signals: interview notes, purchase data, and reviews, not stereotypes from a brainstorm. Key characteristics often include age, gender, income, location, education level, lifestyle, and interests. Example: Emma, 32, a full-time working professional living in an urban area. She values sustainability and convenience when making shopping decisions.
Buyer roles: In B2C, one person often plays multiple roles at once: the decision-maker (the individual making the purchase), the influencer (opinions from friends, family, or social media), and the end-user (the person who actually uses the product). Emma might research a coffee machine herself, ask her sister's opinion, and buy it as the one who will use it daily. Your messaging needs to work for all three roles, even when they live in one head.
Behaviors: Purchase decisions are largely driven by emotion, ease, and brand perception. Typical behaviors include reading online reviews, comparing deals and prices, following trends and influencers, and expecting fast, seamless delivery. Each behavior is a touchpoint you can design for: if Emma reads reviews before every purchase, your review strategy is not optional.
Pains: These are the frustrations and problems customers want to solve. Examples include high prices, lack of trust in brands, difficulty finding the right product, poor customer service, or long delivery times. Every pain on this list is a place where a competitor is currently disappointing someone, which makes it a place where you can win.
Gains: The benefits or desired outcomes customers seek, such as affordability, time savings, quality assurance, convenience, personalization, and a seamless shopping experience. Gains tell you what to promise; pains tell you what to fix first.
Understanding these elements helps you craft better marketing messages, improve customer experience, and drive loyalty. One final tip: a persona is never finished. Revisit Emma every time new data comes in, because she changes faster than your slide deck does.
B2B Customer persona breakdown.
In B2B, decisions are driven less by emotion and more by logic, ROI, and scalability. But behind every business customer is still a human being with goals to achieve, problems to solve, and responsibilities to manage. That's why a well-defined B2B persona is essential to understand who you're truly serving. A strong persona helps you sell smarter, communicate more clearly, and focus your efforts where they matter most.
What is a B2B customer persona?
A B2B persona is a fictional, yet data-driven profile of your ideal business customer segment. It represents a type of person within a specific professional context, based on real insights. It typically includes: Industry or sector, company size, Job title and responsibilities and level of decision-making authority. Example: “Operations manager at a mid-sized logistics company, focused on improving supply chain efficiency and sustainability.”
Buyer roles in B2B
B2B buying decisions usually involve multiple stakeholders. The most common roles include:
- Decision-maker: Approves the final purchase (e.g., CEO, CFO, director)
- Influencer: Recommends or advises on the purchase (e.g., department head, consultant)
- End-User: Uses the product or service in daily operations (e.g., managers, employees)
- Procurement: Manages vendor selection, contracts, and negotiations
- IT or Compliance gatekeeper: Ensures technical fit, security, and regulatory alignment
Common buying behaviors
Business buyers operate differently from consumers. Typical behaviors include:
- In-depth research: Reading whitepapers, watching demos, comparing vendors
- Looking for proof: Case studies, testimonials, ROI-driven outcomes
- Longer buying cycles with multiple decision-makers
- Preference for personalized outreach and industry-specific solutions
- Focus on scalability, integration, and long-term value
Pains (challenges and frustrations)
What holds business customers back? Common pain points include:
- Operational inefficiencies causing high costs
- Difficulty justifying ROI for new investments
- Internal complexity slowing down decision-making
- Compliance and security concerns, especially with tech
- Poor integration with existing systems and workflows
Gains (desired outcomes and benefits)
What are business customers looking to achieve?
- Cost savings and improved operational efficiency
- Higher productivity through process optimization
- Competitive advantage through innovation and automation
- Seamless integration with existing tools
- Reliable vendor support and long-term scalability
A well-defined B2B persona helps businesses tailor messaging, product development, and sales strategies for better engagement and conversion.
Case study · Het Volksportret
From 18 million people to 100 faces.
you don't need real people to segment customers, thankfully!
A new look at the dutch market
As a company trying to establish yourself on the Dutch market, you must understand the potential customer base. More than 18 million individuals live in the Netherlands, each with their own preferences, habits, likes, and dislikes. While this number is modest compared to the vast populations of China, India, or the United States, it nonetheless poses significant challenges for marketing and advertising efforts.
This challenge becomes especially apparent when taking a look at the current state of market research and customer targeting in the Netherlands. The big advertising campaigns usually are conceptualized by one of the big marketing agencies in Amsterdam, where they are being created and decided upon by homogenous groups. Young, progressive and educated individuals living in urban areas with an interest in design. It is no surprise that the outcome usually targets the Dutch “Elites” living in large cities and consequently neglects the majority of the population living beyond those city limits. But who can blame them? After all it is easiest to draw from your own experiences and preferences.
Market research can help gain a better understanding of the 'unknown' segments but to do it properly it requires a process that is both lengthy and costly. Often resulting only in rough approximations of target audiences. While market research has become more accessible, evolving from interviews on markets to the telephone and now to the internet, it still excludes large parts of the population. People with low literacy, be it practical or digital, and people of migrant backgrounds are neglected by this type of research.
This disconnect was precisely what Jens Hellewaard and Luc van den Boogaart identified and set out to fix. Challenging the status quo of an entire industry takes courage, persistence and most importantly, a great idea. But how can you get such a process started?
In the case of Jens and Luc it started with a very simple but profound question: “If the Netherlands were a community of just 100 people, what would that look like?”
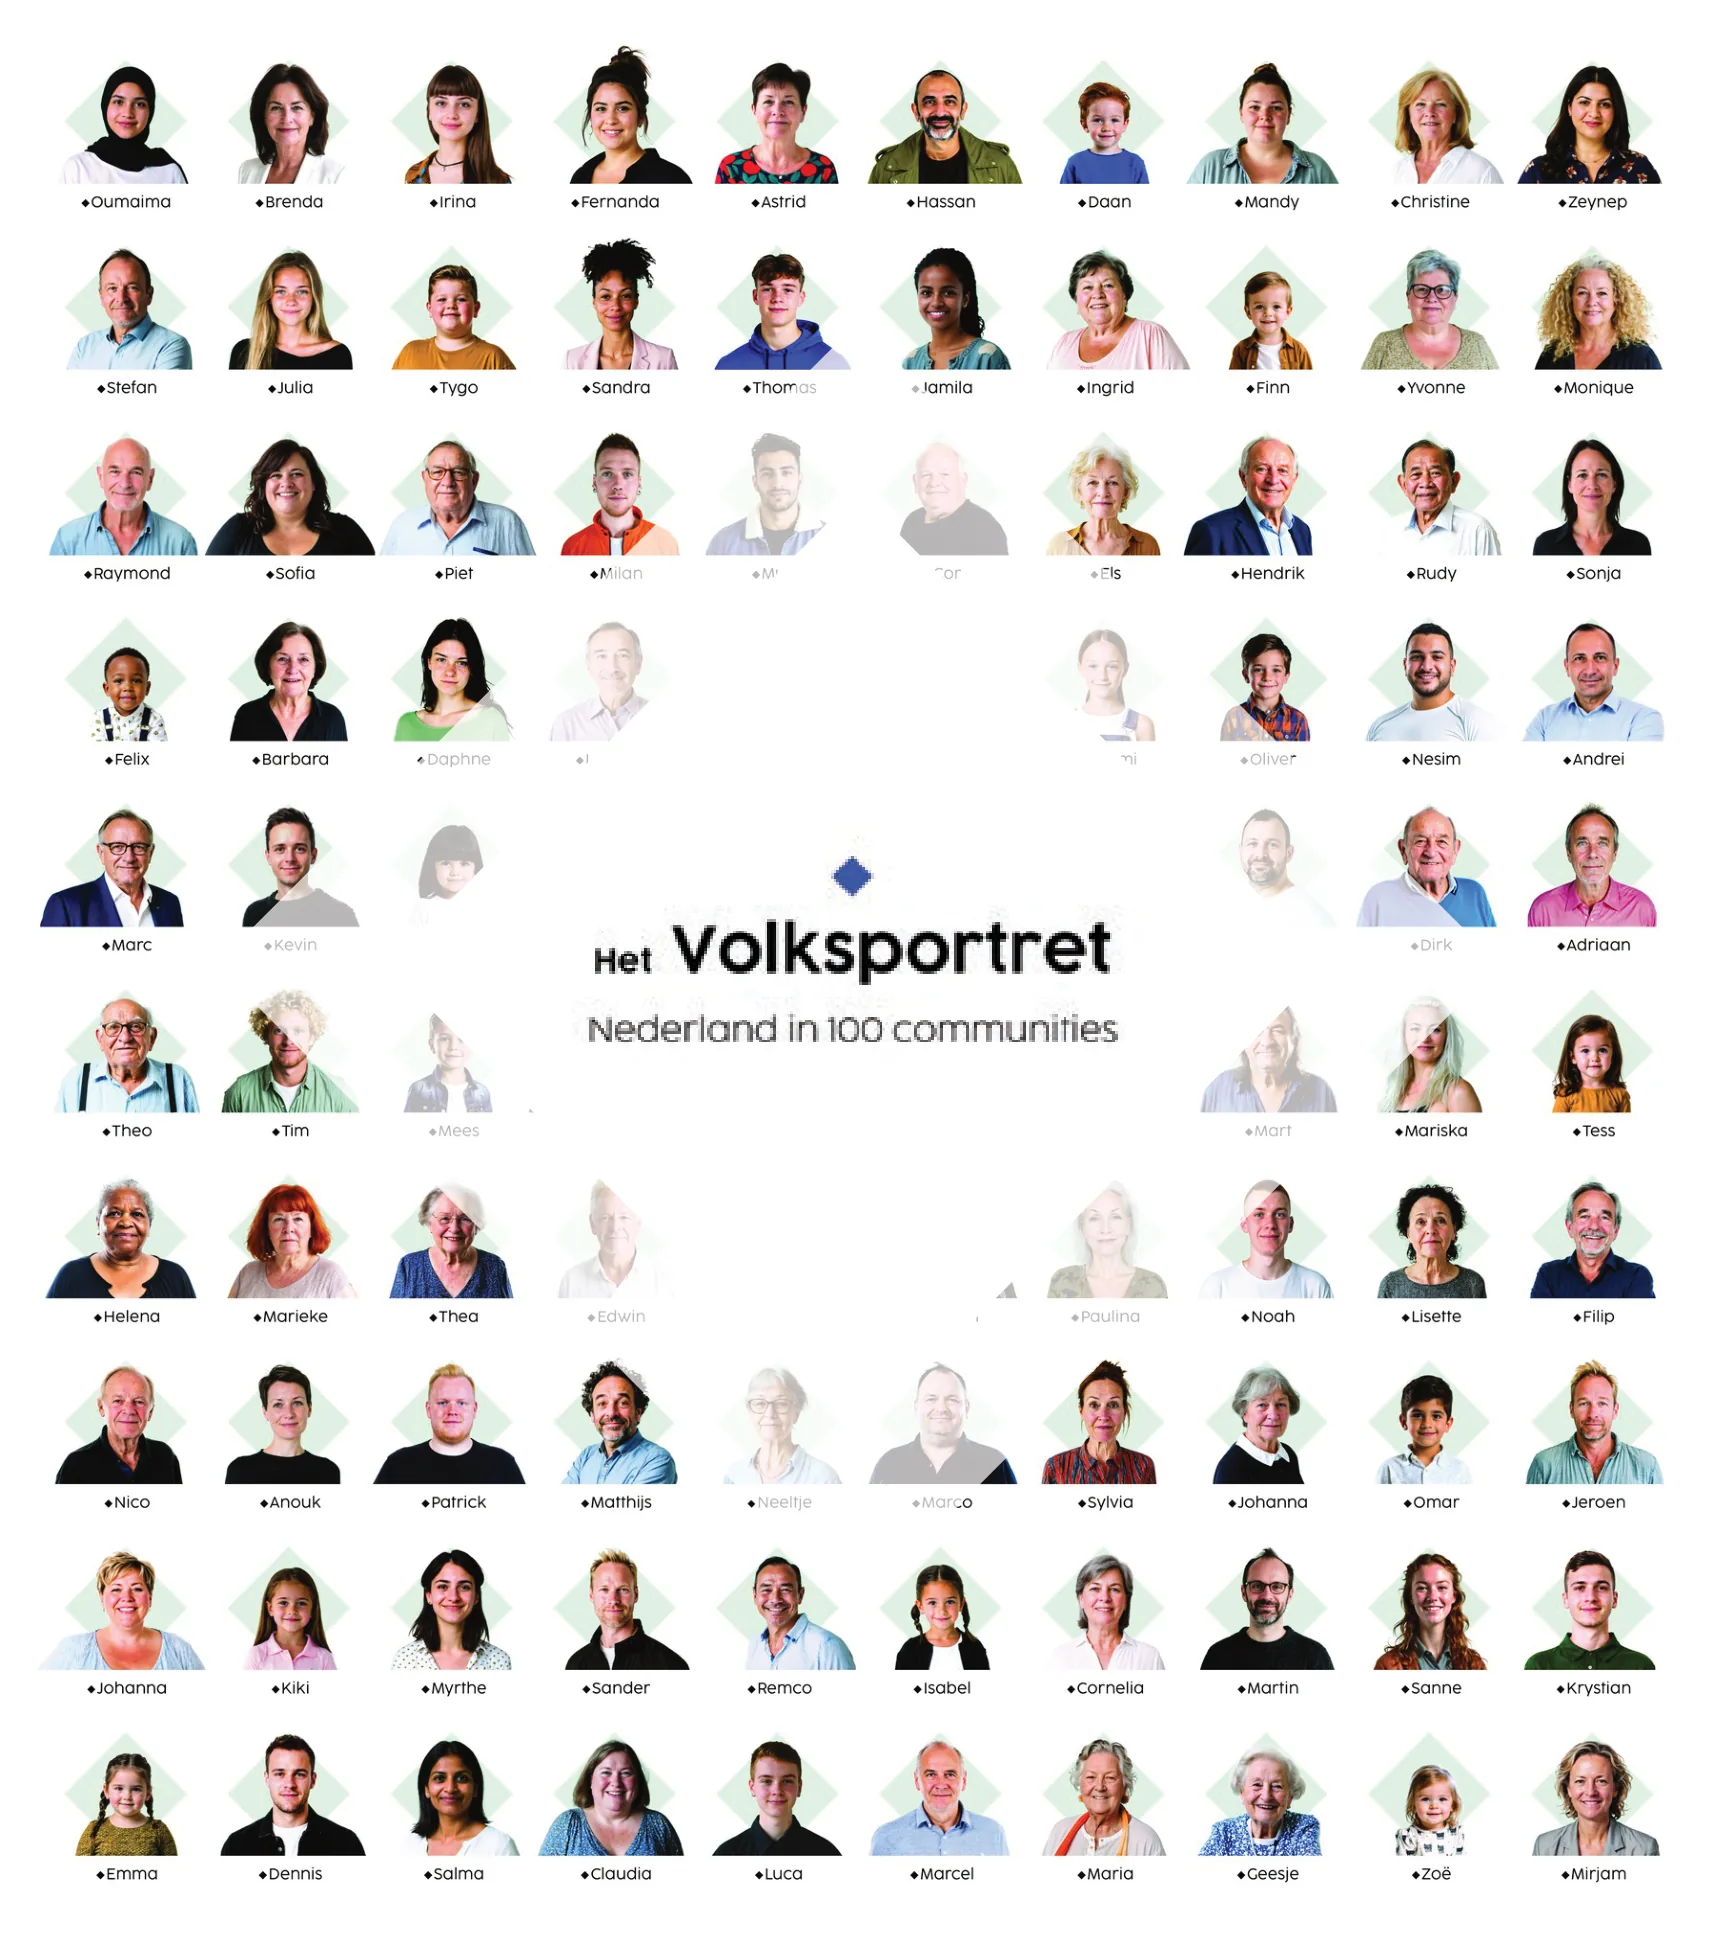
Today, the answer to that question is visualized on their website, in the office of CEO Jens Hellewaard, and at the end of this case study: 100 faces, each representing one % of the Dutch population. These portraits embody personas defined by age, place of residence, gender, habits, preferences, and personality traits.
The underlying idea being that all members of one community should be as similar to each other and as different to other communities as possible. Each community is thus designed to be internally cohesive yet externally distinct. Het Volksportret was first brought to life.
Transforming raw data into actionable insights
The foundation of Het Volksportret lies in data drawn from the Dutch national base register, covering essential demographic information such as place of residence, age, gender, nationality, and religion for over 18 million people.
While this information has long been available to marketers, they merely describe who people are, not why they act as they do.
To bridge that gap, Hellewaard and van den Boogaart launched an ambitious quantitative study aimed at mapping personality traits, habits, and preferences across a broad and representative sample of the Dutch population.
The resulting database now assigns a little under 150 characteristics to each of the 100 communities, forming the backbone of what the founders call a “hive-mind personality.” With this, every persona is not just a demographic type, but a living, evolving model that reflects real-world behaviors and attitudes. Het Volksportret's AI-driven clustering algorithm processes all of this information, adjusting for differing units and scales while assigning appropriate weights to each characteristic. Certain metrics, such as age, receive heavier weighting because of their strong influence on other variables like income, health, and digital usage.
In order to ensure maximum representativeness, the demographic data is continuously updated. Should other credible studies promise to enrich the characteristics used to define the communities, the platform will review those and, if applicable, add them to the data pool. Customers of this software are also able to apply their own data to the communities, allowing for personalized market research.
The communities are created, and the characteristics are assigned. But the true Value Proposition of Het Volksportret does not lie in creating representative communities, but in bringing them alive.
AI, the catalyst for innovation
While AI already helped power the algorithm that made the creation of the communities possible, its main purpose within this platform is to help forming actionable output. To this end a large language model (LLM) was created which takes on all of the previously determined characteristics and can then answer questions based on those parameters.
This technology combined with the extensive underlying data allows the communities representing the entire population of the Netherlands to become interactive personas that can be communicated with. For example, the “Sandra”- Community can as such be treated like a real person to conduct market research. If you want to know whether a new product resonates with the 180.000 people represented by Sandra, you can simply ask her about it.
“Would you buy this product?”; “Do you prefer design A or design B?”; “Which channels can you best be reached through?”; “Are there specific deals and offers that would increase the chances of you buying this product?”. The list of questions is endless, and you can fire them off one after the other. For each you will receive a precise answer that is based on real, documented insights.
Through Het Volksportret you have instant and unlimited access to all possible customer segments. You can survey all communities at once or hone in on specific parts of the population. If you only want to survey potential customers that are from the south of the country, 18 years or older, or even only those who smoke cigarettes, you are merely one click of a button away.
The algorithm is constantly evolving and improving. It learns with every new prompt and as such is only going to get more effective. The output of the LLM's first prototype managed to achieve alignment of over 80% with the results of traditional market research and since then has only improved further. At the moment, the recommendation of the founders is to use it alongside traditional tools, as it hasn't yet become reliable enough to fully replace quantitative research with confidence. However, one can only imagine how advanced this technology might be in 5 or in 10 years. Already now it delivers correct insights in the vast majority of cases and does so significantly faster and cheaper, as well as in a more representative manner than traditional methods.
Between a marketer's question and the answer now lie only a few milliseconds of processing time, instead of the traditional “three weeks and twenty thousand Euros,” as Hellewaard matter-of-factly puts it.
Summary: Comparison to traditional methods
Positives:
- Shorter time to market
- Real-time customer insights
- Lower costs
- Customization through user data
- Constantly evolving and improving model
- More inclusive understanding of the market
- More nuanced customer segmentation
- Allows integration of customer surveys in every step of the process
Negatives:
- Potential bias in model assumptions
- Still at the start of the learning curve
- No face-to-face contact with customers
- While based on factual data, answers are only approximations
- No direct representation for niche markets
“It is our goal that soon every Dutch marketing expert is aware what is meant when a customer orders a campaign for the 'Sandra'- community.” — Jens Hellewaard
As of today, Het Volksportret shows the potential to uproot conventional customer segmentation and market research. While for the moment it may be safer to use the software alongside the traditional methods, it may someday replace them entirely. Ultimately, only time will tell whether the goal of Jens Hellewaard and Luc van den Boogaart will be achieved.
In the meantime, we would like to take the first step and introduce you to 'Sandra' and some of the other communities representing the Dutch society.